
चित्र:Table isotopes en.svg

पूर्वावलोकन PNG का आकार SVG फ़ाइल: 419 × 600 पिक्सेल दूसरे रेसोल्यूशन्स: 168 × 240 पिक्सेल | 335 × 480 पिक्सेल | 537 × 768 पिक्सेल | 715 × 1,024 पिक्सेल | 1,431 × 2,048 पिक्सेल | 580 × 830 पिक्सेल।
मूल चित्र (SVG फ़ाइल, साधारणतः 580 × 830 पिक्सेल, फ़ाइल का आकार: 215 KB)
सारांश
| विवरण |
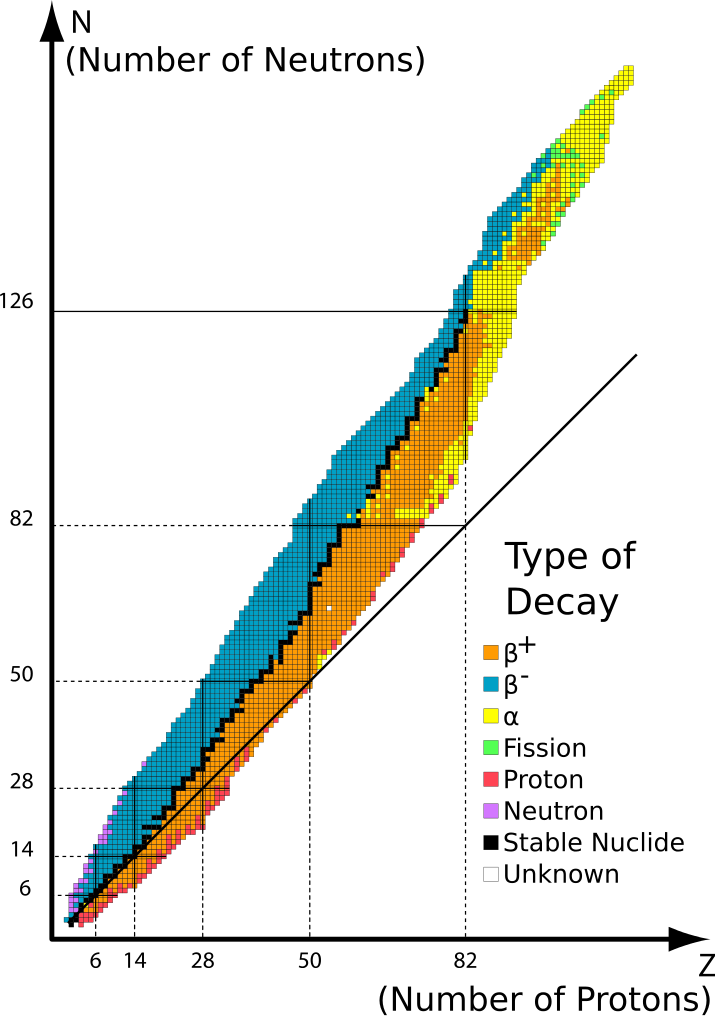
Deutsch: Auftragung von Isotopen nach Art des radioaktiven Zerfalls. Orange und blaue Nuklide sind instabil, schwarze Kästen dazwischen zeigen stabile Nuklide. Die durchgezogene Linie repräsentiert die theoretische Position der Nuklide bei der Protonen- und Neutronenanzahl identisch sind. Es zeigt sich, dass Elemente mit mehr als 20 Protonen mehr Neutronen benötigen um stabil zu sein.
English: Graph of isotopes by type of nuclear decay. Orange and blue nuclides are unstable, with the black squares between these regions representing stable nuclides. The unbroken line passing below many of the nuclides represents the theoretical position on the graph of nuclides for which proton number is the same as neutron number. The graph shows that elements with more than 20 protons must have more neutrons than protons, in order to be stable.
Français : Table des isotopes par type de désintégration majoritaire, convertie depuis les données du programme Nucleus. |
| दिनांक | (UTC) |
| स्रोत | |
| लेखक |
|
| दूसरे संस्करण |
Derivative works of this file: []
|


|
The file size of this SVG image may be abnormally large because most or all of its text has been converted to paths rather than using the more conventional
<text> element. Unless rendering the text of the SVG file produces an image with text that is incurably unreadable due to technical limitations, it is highly recommended to change the paths back to text. Doing so will ease the process of localizing this image to other languages and is likely to reduce the file size in a significant scale. Other SVGs containing path-based text can be found at Category:Path text SVG. For more information, see SVG: Fonts and Preparing images for upload: Text.
|

|
लाइसेंस
मैं, इस कार्य का/की कॉपीराइट धारक, इसे निम्न लाइसेंसों के अंतर्गत प्रकाशित करता/करती हूँ:
इस फ़ाइल को क्रिएटिव कॉमन्स श्रेय-समानसांझा 3.0 अनरिपोर्टेड, 2.5 साधारण, 2.0 साधारण और 1.0 साधारण लाइसेंस के अंतर्गत लाइसेंस किया गया है।
- आप खुलकर:
- बाँट सकते हैं – रचना की प्रतिलिपि बना सकते हैं, बाँँट सकते हैं और संचारित कर सकते हैं
- रीमिक्स कर सकते हैं – कार्य को अनुकूलित कर सकते हैं
- निम्नलिखित शर्तों के अंतर्गत:
- श्रेय – यह अनिवार्य है कि आप यथोचित श्रेय प्रदान करें, लाइसेंस की कड़ी प्रदान करें, और अगर कोई बदलाव हुए हों तो उन्हें इंगित करें। आप ऐसा किसी भी उचित तरीके से कर सकते हैं, लेकिन किसी भी तरह उससे यह नहीं संकेत नहीं किया जाना चाहिए कि लाइसेंसधारी द्वारा आपको अथवा आपके इस प्रयोग का समर्थन किया जा रहा हो।
- समानसांझा – अगर आप इस रचना में कोई बदलाव करते हैं या इसपर आधारित कुछ रचित करते हैं तो आप अपने योगदान को सिर्फ इसी या इसके सामान किसी लाइसेंस के अंतर्गत बाँट सकते हैं।

|
इस दस्तावेज़ को Free Software Foundation द्वारा प्रकाशित GNU मुक्त प्रलेख लाइसेंस के संस्करण 1.2 या नए (बिना किसी अपरिवर्तनीय अनुभागों और अगले या पिछले आवरण के टेक्स्ट के) के अंतर्गत प्रतिलिपि बनाने, बाँटने और/या बदलने की अनुमति प्रदान की जाती है। इस लाइसेंस की एक प्रतिलिपि GNU मुक्त प्रलेख लाइसेंस नामक अनुभाग में शामिल है। |
आप अपना पसंद का लाइसेंस चुन सकते हैं।
मूल अपलोड लॉग
This image is a derivative work of the following images:
- File:Table_isotopes.svg licensed with Cc-by-sa-3.0,2.5,2.0,1.0, GFDL
- 2008-05-21T21:32:39Z Napy1kenobi 580x830 (617205 Bytes) Table des isotopes par type de désintégration majoritaire, convertie depuis les données du programme Nucleus, fond caché sous Inkscape retiré. [[Category:Chart of nuclides]] [[Category:Decay]]
- 2008-05-21T21:29:04Z Napy1kenobi 842x830 (1084210 Bytes) {{Information |Description=Table des isotopes par type de désintégration majoritaire, convertie depuis les données du programme Nucleus. |Source=travail personnel |Date=2008-05-21 |Author= [[User:Napy1kenobi|Napy1kenobi]]
Uploaded with derivativeFX
| Annotations | This image is annotated: View the annotations at Commons |
चित्र का इतिहास
चित्र पुराने समय में कैसी दिखती थी यह जानने के लिए दिनांक/समय पर क्लिक करें।
| दिनांक/समय | थंबनेल | आकार | सदस्य | टिप्पणी | |
|---|---|---|---|---|---|
| वर्तमान | 07:48, 5 अप्रैल 2010 | | 580 × 830 (215 KB) | Quibik | Made the source code more compact. |
| 14:55, 5 मई 2009 |  | 580 × 830 (695 KB) | Sjlegg | {{Information |Description=Table of isotopes by type of nuclear decay. |Source=*File:Table_isotopes.svg |Date=2009-05-05 10:23 (UTC) |Author=*File:Table_isotopes.svg: Napy1kenobi *derivative work: ~~~ |Permission=see below |
चित्र का उपयोग
यह पृष्ठ इस चित्र का इस्तेमाल करता है:
चित्र का वैश्विक उपयोग
इस चित्र का उपयोग इन दूसरे विकियों में किया जाता है:
- az.wikipedia.org पर उपयोग
- beta.wikiversity.org पर उपयोग
- bn.wikipedia.org पर उपयोग
- ca.wikipedia.org पर उपयोग
- el.wikipedia.org पर उपयोग
- en.wikipedia.org पर उपयोग
- en.wikibooks.org पर उपयोग
- en.wikiversity.org पर उपयोग
- User:Marshallsumter/Keynote lectures (draft)/Geology
- Draft:Original research/Radiation
- User:Marshallsumter/Radiation astronomy/Electrons
- User:Marshallsumter/Radiation astronomy1/Positrons
- User:Marshallsumter/Keynote lectures (draft)/Neutron radiation astronomy
- User:Marshallsumter/Radiation astronomy1/Neutrinos
- User:Marshallsumter/Radiation astronomy2/Subatomics
- User:Marshallsumter/Radiation astronomy/Beta particles
- Draft:Original research/Nuclear physics
- Radiation/Neutrons
- User:Marshallsumter/Radiation astronomy2/Transmutations
- Charges/Nuclear physics
- Chemicals/Borons
- es.wikipedia.org पर उपयोग
- fa.wikipedia.org पर उपयोग
- fi.wikipedia.org पर उपयोग
- fr.wikipedia.org पर उपयोग
- he.wikipedia.org पर उपयोग
- hr.wikipedia.org पर उपयोग
- hu.wikipedia.org पर उपयोग
- id.wikipedia.org पर उपयोग
- ja.wikipedia.org पर उपयोग
- ms.wikipedia.org पर उपयोग
- pnb.wikipedia.org पर उपयोग
- sv.wikipedia.org पर उपयोग
- sv.wikibooks.org पर उपयोग
- ta.wikipedia.org पर उपयोग
इस चित्र के वैश्विक उपयोग की अधिक जानकारी देखें।